Chart USD/BRL Update: Balanced at fresh 2024 year highs - studies remain positive

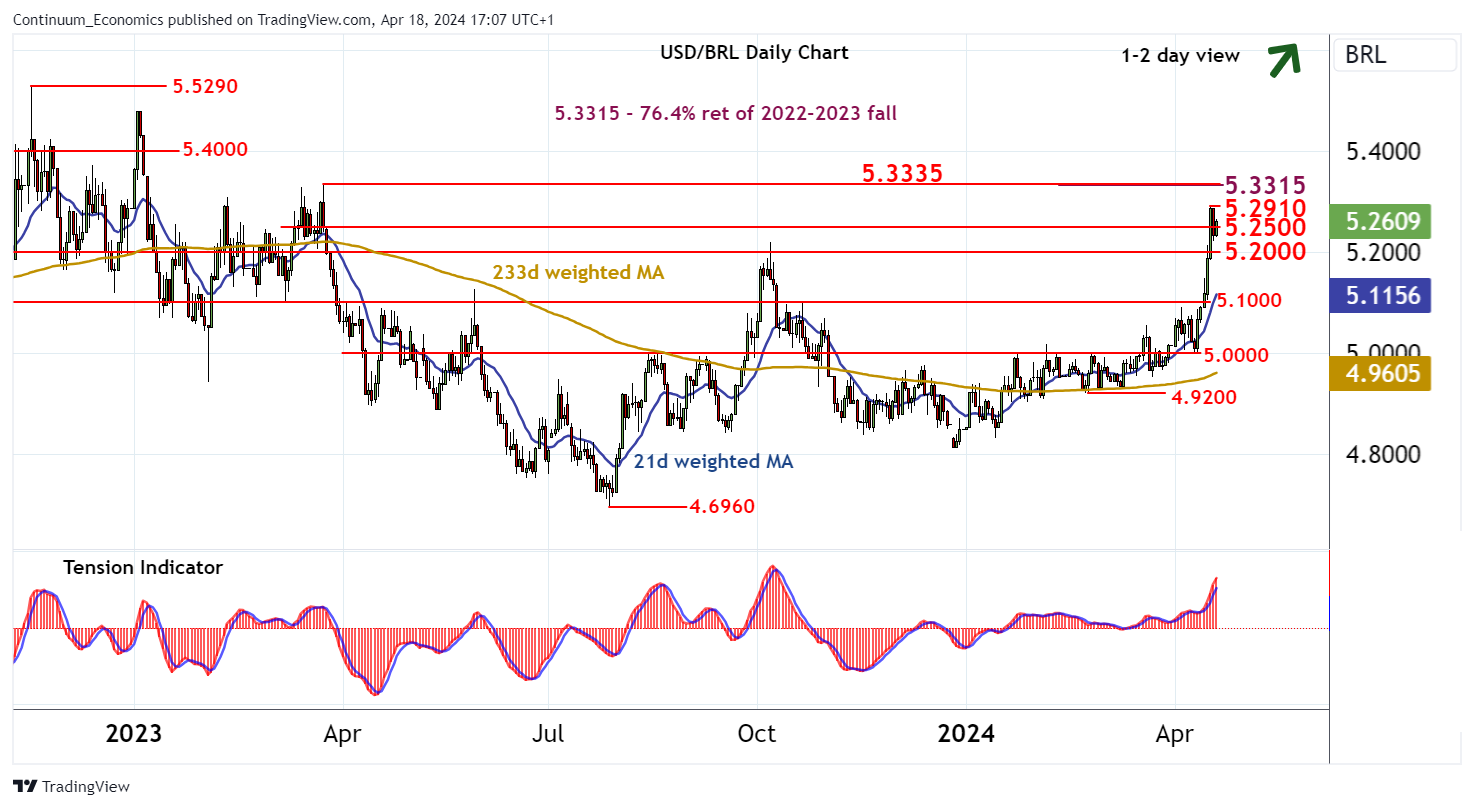
Anticipated gains have reached fresh 12-month highs around 5.2900
| Levels | Imp | Comment | Levels | Imp | Comment | |||
|---|---|---|---|---|---|---|---|---|
| R4 | 5.4800 | ** | 3 Jan 2023 (y) high | S1 | 5.2500 | * | congestion | |
| R3 | 5.4000 | * | congestion | S2 | 5.2000 | ** | congestion | |
| R2 | 5.3315/35 | ** | 76.4% ret of 2022-2023 fall; 24 Mar 2023 (m) high | S3 | 5.1000 | * | congestion | |
| R1 | 5.2910 | * | 16 Apr YTD high | S4 | 5.0700 | * | 31 Oct (w) high |
Asterisk denotes strength of level
16:55 BST - Anticipated gains have reached fresh 12-month highs around 5.2900, where unwinding overbought daily stochastics are prompting a pullback towards congestion support at 5.2500. In the coming sessions, cautious trade is highlighted, but the rising daily Tension Indicator and mixed/positive weekly charts highlight room for still further strength. A later close above 5.2910 will turn sentiment outright positive and extend July 2023 gains towards critical resistance at 5.3315/35. Overbought weekly stochastics could prompt more significant selling pressure around here. Meanwhile, a close below congestion support at 5.2000, if seen, will turn price action negative and give way to a swift pullback towards 5.1000.